
Understanding Cardio Activity Details
Cardio Activity Details provides a complete breakdown of a recorded cardio workout. The information available depends on the activity, recording device, and data collected during the workout.
View Cardio Activity Details
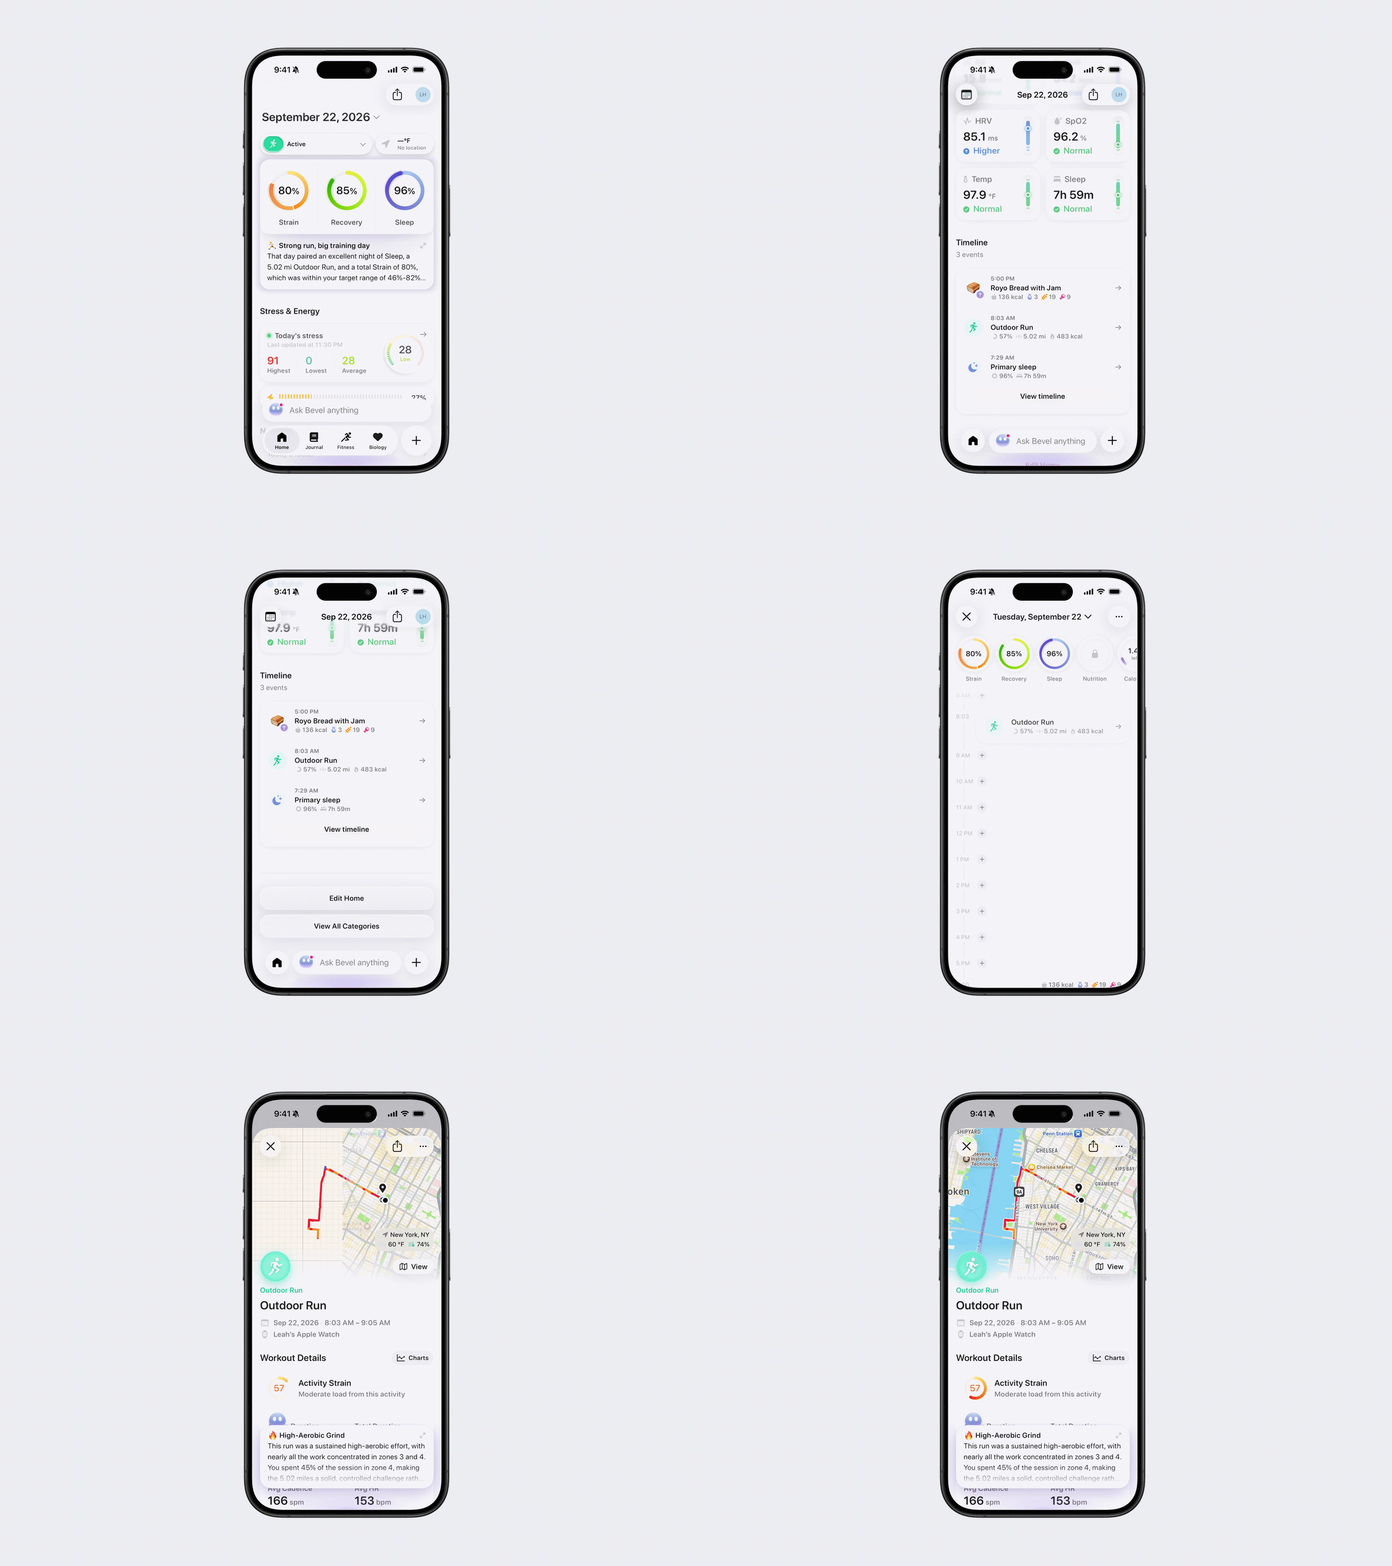
Option 1: Via Timeline
Open Bevel.
Scroll down to Timeline.
Tap View Timeline.
Tap the cardio activity you want to view.
Option 2: Via the Fitness Tab
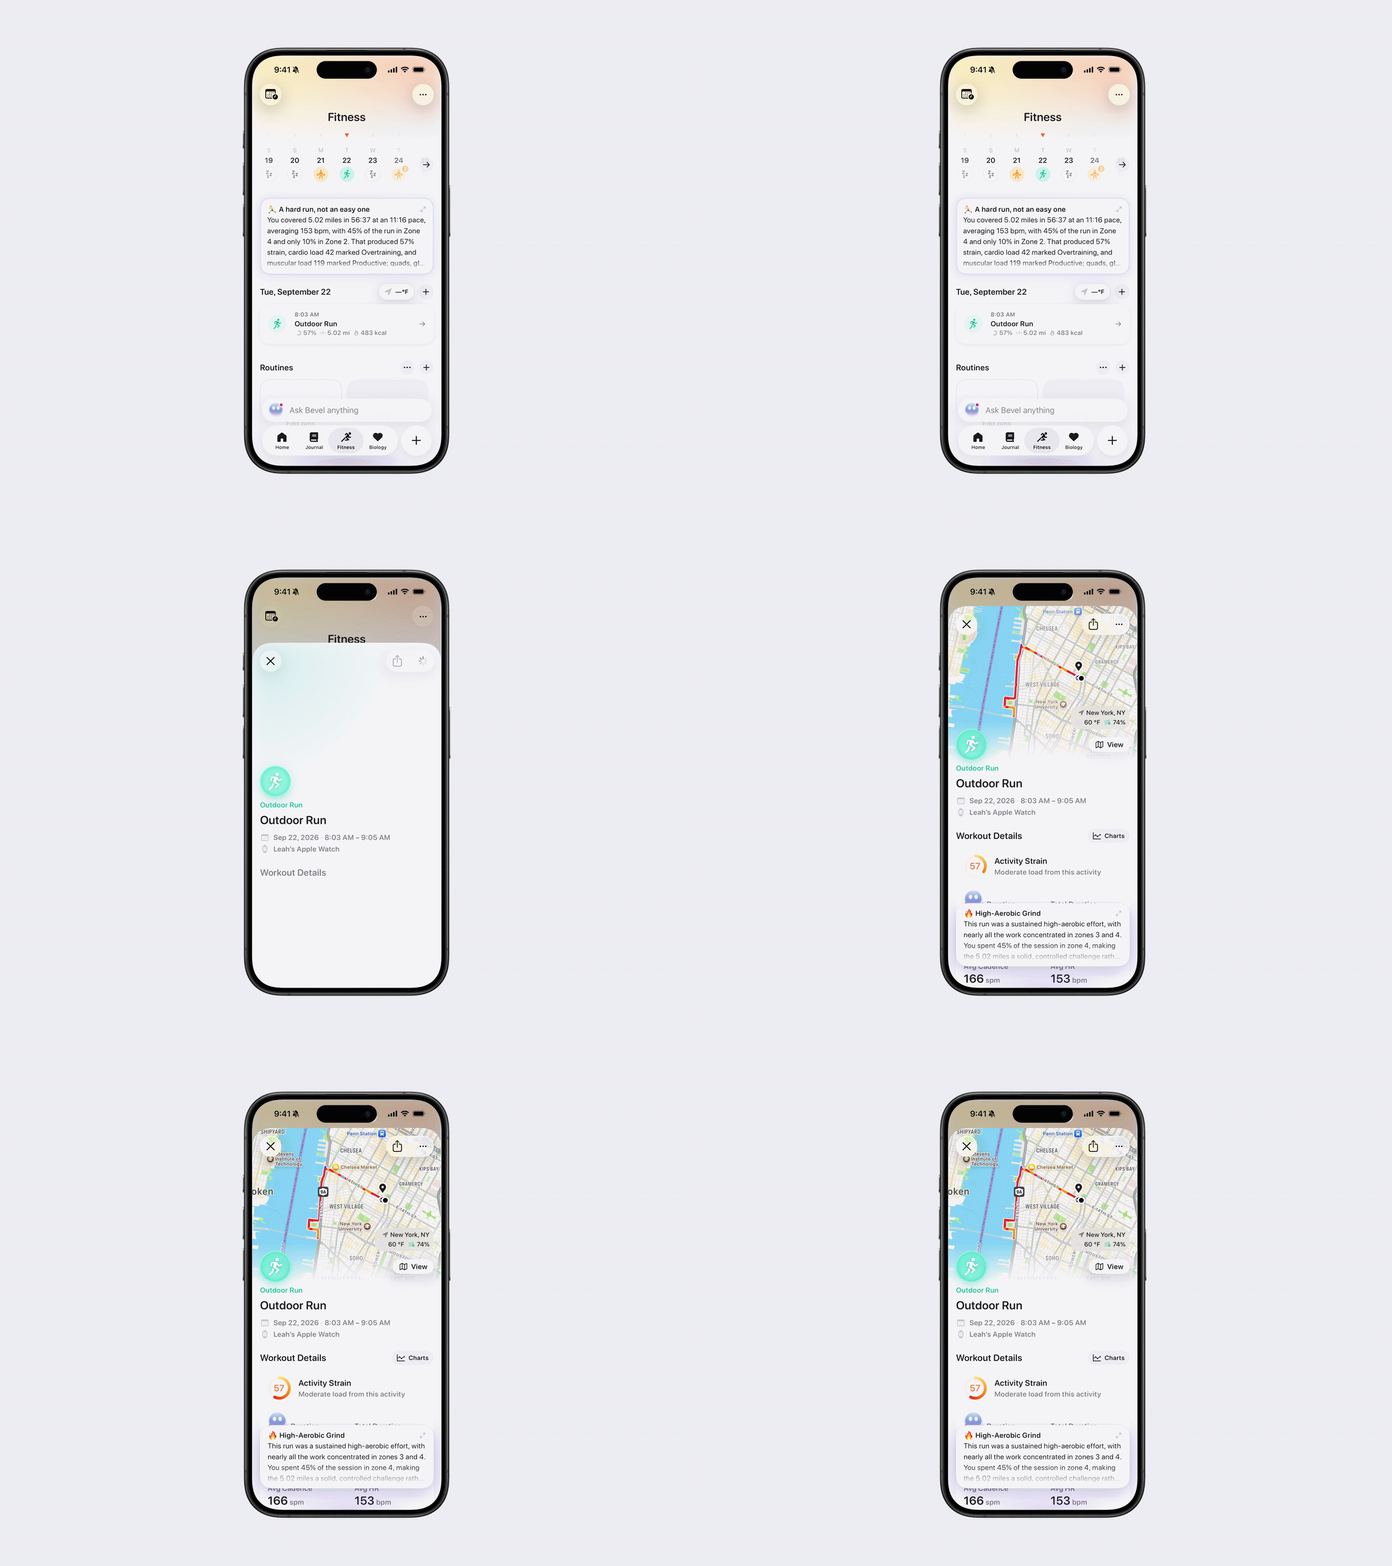
Open Bevel.
Go to the Fitness Tab.
Scroll down to Today’s Activity.
Tap the cardio activity you want to view.
Activity Summary
At the top of Activity Details, you’ll see:
Activity title
Date and time
Device used to record the activity
View the Activity Map
For supported activities with route data:
Tap View on the map.
Drag your finger along the route to review data from different points in the workout.
Tap the current metric to change the data displayed.
Available map metrics depend on the activity and recorded data.
To change the map style:
Tap the map icon in the top-right corner.
Select Default or Satellite.
Tap the X in the top-left corner to close the map.
Activity Options
Tap the three dots (...) in the top-right corner to access the following options:
Sync to Strava
Unlink Activity, if the workout is linked to another activity
Save as New Routine
Edit Log Details
Delete
Edit Cardio Activity Details
Tap the three dots (...) in the top-right corner.
Tap Edit Log Details.
Update any available details, including:
Title
Date
Duration
Active Energy
Distance
Elevation
Perceived Effort
Reflection
Tap the checkmark in the top-right corner to save your changes.
Available fields depend on the activity type.
Customize Cardio Activity Charts
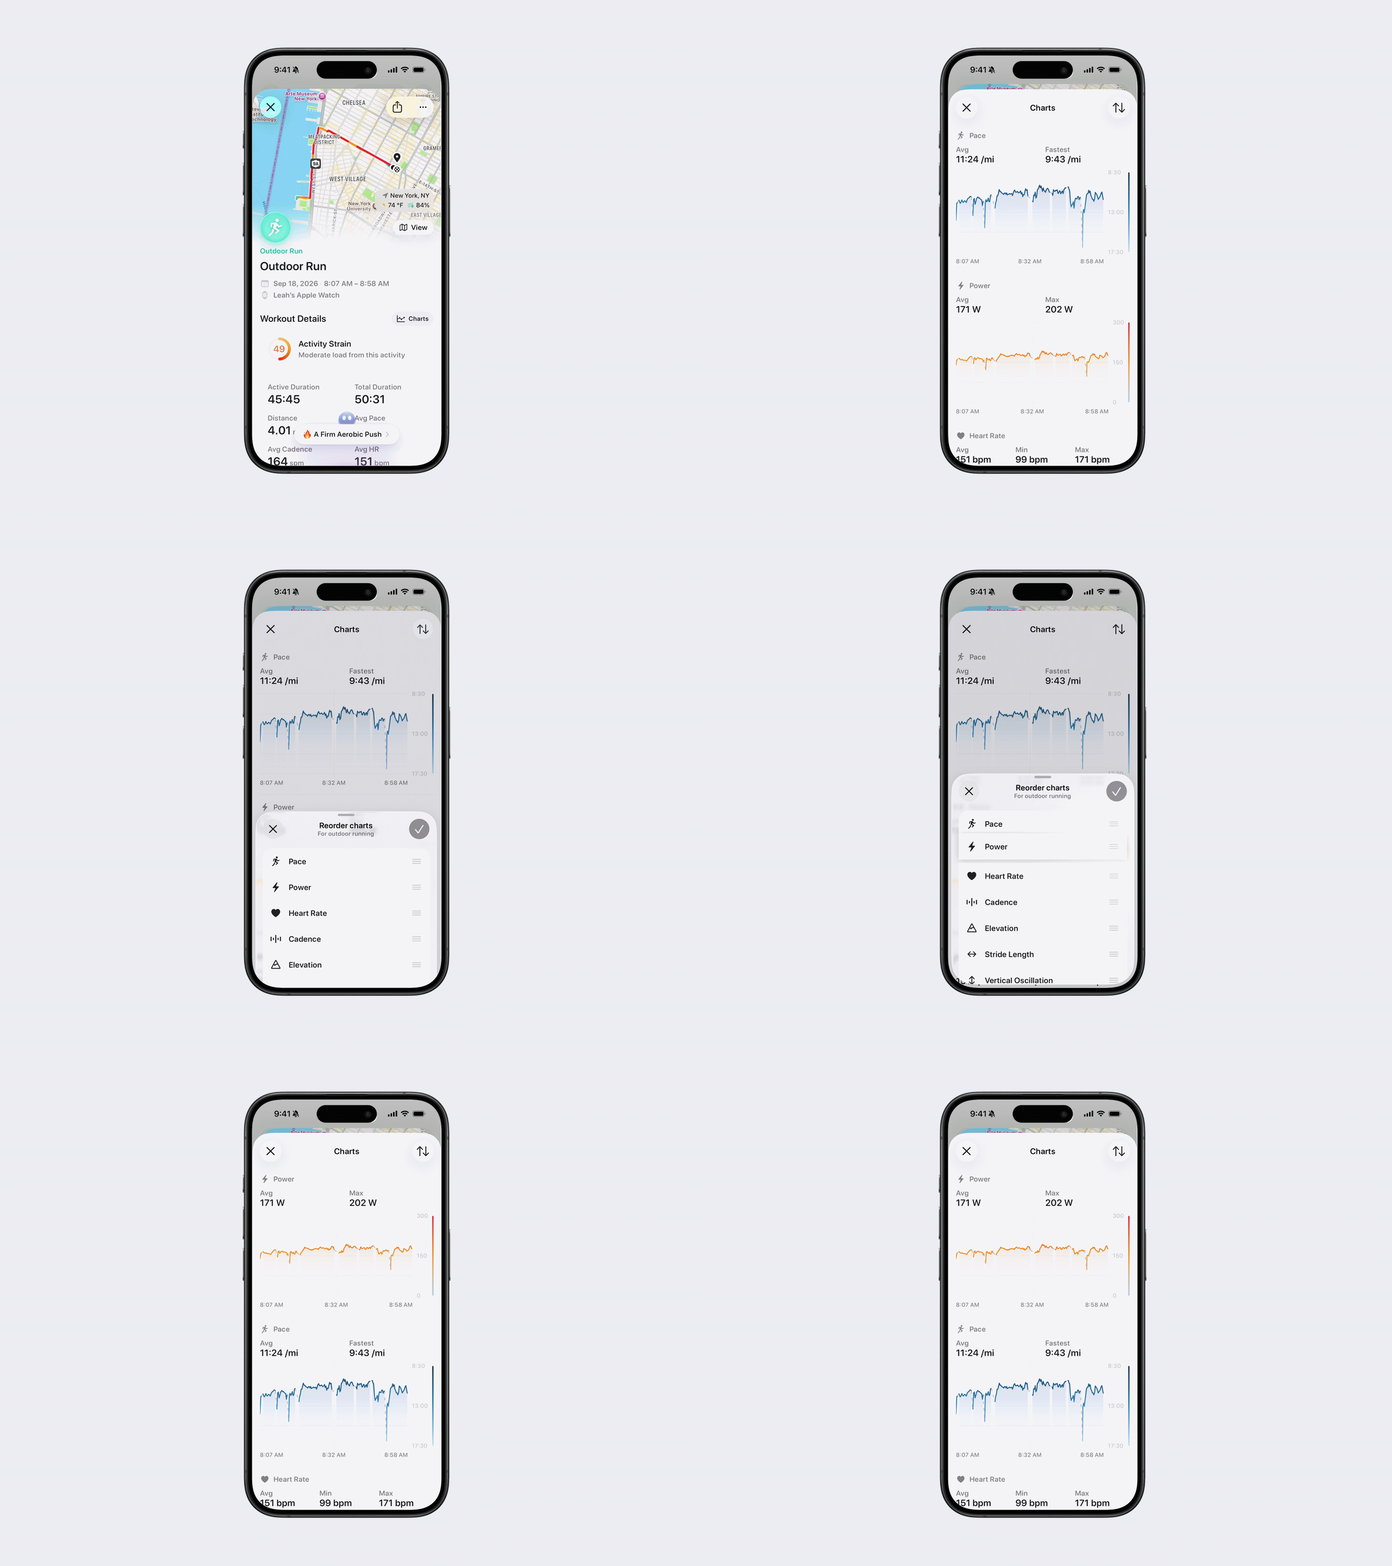
Under Workout Details, tap Charts to view and customize the charts available for the activity. Scrub through a chart to view data at a specific point in time.
Charts may include:
General: Elevation and Heart Rate
Cycling: Speed, Cadence, and Power
Running: Pace, Cadence, Stride Length, Vertical Oscillation, and Ground Contact Time
Swimming: Pace and Cadence
Rowing: Pace
To reorder your charts:
Tap the reorder icon in the top-right corner.
Press and hold a chart, then drag it to your desired position.
Tap the checkmark in the top-right corner to save.
Tap the X in the top-left corner to exit.
Personal Records
Any Personal Records you set during this activity will appear here.
Activity Strain
Activity Strain shows how much the workout contributed to your total daily Strain:
0: No added Strain
1–20: Little physical demand
21–40: Slightly increased your daily Strain
41–60: Added noticeable Strain
61–80: Made up a major part of today’s Strain
80+: Added a very high load from this activity
Cardio Workout Metrics
The metrics shown under Workout Details depend on the activity:
Activity | Available metrics |
Running | Active Duration, Total Duration, Distance, Avg Pace, Avg Cadence, Avg HR, Avg Power, Active Energy, Total Energy |
Cycling | Active Duration, Total Duration, Distance, Avg Speed, Avg Cadence, Avg HR, Elevation Gain, Avg Power, Active Energy, Total Energy |
Pool Swim | Active Duration, Total Duration, Distance, Avg Pace, Avg HR, Laps, Pool Length, Active Energy, Total Energy |
Open-Water Swim | Active Duration, Total Duration, Distance, Avg Pace, Cadence, Avg HR, Active Energy, Total Energy |
Multisport | Active Duration, Total Duration, Distance, Avg HR, Active Energy, Total Energy |
Other Activity | Active Duration, Total Duration, Avg HR, Active Energy, Total Energy |
Tap All Metrics to view the complete list of available workout data.
Perceived Effort
Perceived Effort reflects how difficult the workout felt:
1: Minimal Effort
2: Very Light
3: Light
4: Moderate
5: Tiring
6: Somewhat Hard
7: Hard
8: Very Hard
9: Extremely Hard
10: Maximum Effort
You can update Perceived Effort through Edit Log Details.
Heart
The Heart section may include:
Cardio Load: The workout’s contribution to your cardiovascular training load
Heart Rate: Your average, minimum, and maximum heart rate, along with a chart
Heart Rate Zones: The percentage of the workout and heart rate range spent in each zone
Cardio Focus: Your percentage and Cardio Points across Low Aerobic, High Aerobic, and Anaerobic training
Heart Rate Recovery: The difference between your peak exercise heart rate and your heart rate during recovery
Cardio Load statuses include Calibrating, Detraining, Maintaining, Productive, Peaking, Fatigued, and Overtraining.
Muscles
When available, the Muscles section includes:
Muscular Load
Muscle Breakdown
Tap See More under Muscle Breakdown to view all the muscle groups used during the workout.
Intervals
For supported workouts, the Intervals section displays a breakdown of each recorded interval.
Running Intervals
Interval
Duration
Distance
Avg Pace
Avg HR
Avg Power
Avg Cadence
Elevation Gain
Cycling Intervals
Interval
Duration
Distance
Avg Speed
Avg HR
Avg Power
Avg Cadence
Elevation Gain
Scroll horizontally to view all available interval metrics. Tap the expand icon next to Intervals to open the complete table. Rotate your device to landscape to view more metrics at once.
Splits
For supported activities, the Splits section divides your workout into selected distance increments.
Tap the current split distance to select a different increment.
Activity | Available split distances |
Indoor Run | 1, 5, or 10 mi/km |
Outdoor Run | 1, 5, or 10 mi/km |
Track and Field | 1, 5, or 10 mi/km |
Wheelchair Run Pace | 1, 5, or 10 mi/km |
Hiking | 1, 5, or 10 mi/km |
Indoor Walk | 1, 5, or 10 mi/km |
Outdoor Walk | 1, 5, or 10 mi/km |
Wheelchair Walk Pace | 1, 5, or 10 mi/km |
Indoor Cycle | 5, 10, or 20 mi/km |
Outdoor Cycle | 5, 10, or 20 mi/km |
Hand Cycling | 5, 10, or 20 mi/km |
Elliptical | 1, 5, or 10 mi/km |
Open-Water Swim | 100, 500, or 1,000 yd/m |
Pool Swim | 100, 500, or 1,000 yd/m |
Paddle Sports | 1, 5, or 10 mi/km |
Rowing | 500 m, 1 km, or 2 km |
Sailing | 1, 5, or 10 mi/km |
Cross-Country Skiing | 1, 5, or 10 mi/km |
Skating Sports | 1, 5, or 10 mi/km |
The Splits table may include:
Distance
Duration
Speed or Pace
Heart Rate
Power
Cadence
Elevation Gain
Scroll horizontally to view all available metrics. Tap the expand icon next to Splits to expand the complete table. Rotate your device to landscape to view more metrics at once.