
How to Understand Trend Charts
Trend charts in Bevel help you track your progress over time, giving you a visual view of your habits, metrics, and goals. They make it easier to identify patterns, stay on track, and make adjustments based on your data.
This article explains how to view, interpret, and customize Trend charts in Bevel.
Accessing Trend Charts
Option 1: View Per Metric
To view Trend charts:
Open Bevel.
In any section you click into, scroll down to see Trends.
Examples include Strain, Recovery, Sleep, Stress, and Nutrition, as well as other health monitoring areas.
Option 2: View All Categories
You can also view all Trends at once on the Home Tab:
Scroll to the bottom of the Home Tab.
Tap View All Categories and scroll down to browse Trends across sections.
Reading Trend Charts
Each chart may display slightly different information, but most follow similar visual patterns:
Dotted line: Represents your average over that specific time period
Shaded area: Shows the rolling 30-day variability of your metric.
Colors: Some charts use color changes to represent intensity levels (e.g., low, medium, high) or value quality (e.g., bad to good).
You can adjust the chart view:
Select a timeframe: 1M, 3M, 6M, or 1Y.
Note: Each data point represents a different time range depending on the view. In the 1M view, each point represents 1 day of data; in the 3M view, each point represents 3 days; in the 6M view, each point represents 6 days; and in the 1Y view, each point represents 1 month.
Use the calendar button to view previous months or custom periods.
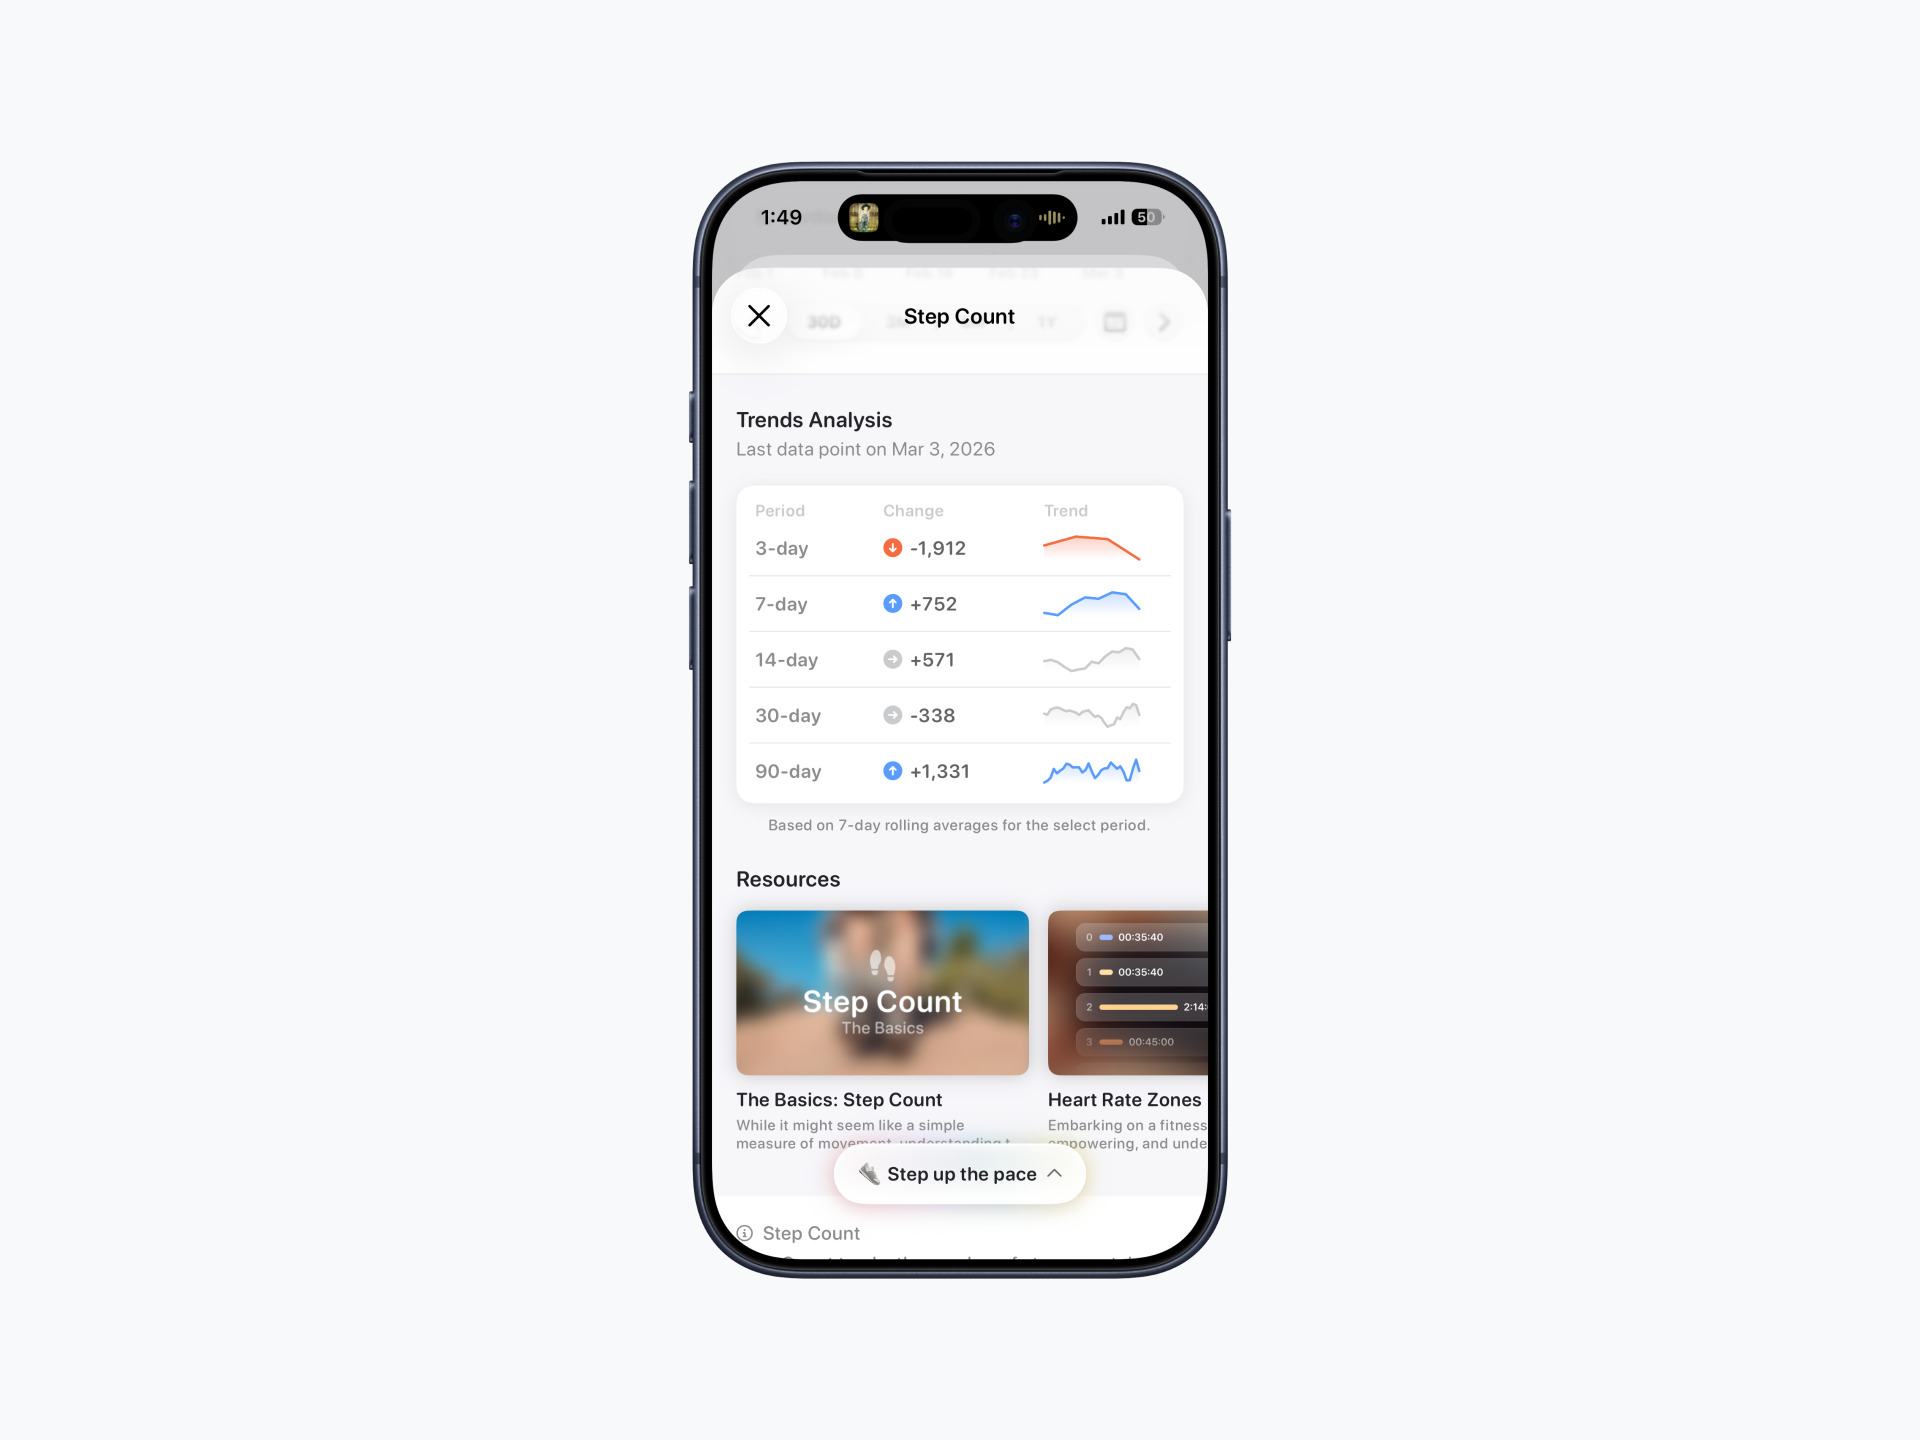
Trends Analysis
Trends Analysis can be found at the bottom of each chart. Most charts show 3-day to 90-day changes and Trends based on a 7-day rolling average. Trends are indicated by arrows: an upward arrow shows an increase, a downward arrow shows a decrease, and a right-pointing arrow indicates no change or only a slight change.
Some charts show Trends that are more specific to the metric. These include:
Macro Balance: shows weekly macro breakdown by average or total.
Net Energy: shows whether you are in a deficit or surplus.
Cycle Trends: show your average and maximum deviations for each cycle phase.
Using Trend charts regularly helps you understand your progress and make more informed decisions to reach your goals.
Why are my Trends grey?
Grey trends indicate the change is not statistically significant over the selected time period.