Understanding Glucose Impact
Glucose Impact measures how your food choices affect your blood sugar levels throughout the day and after individual meals. It is a key component of your Nutrition Score and helps you understand the metabolic impact of what you eat.
You’ll receive both a Food Quality Score and a Glucose Impact Score. Together, these make up your overall Nutrition Score. When connected to a CGM (Continuous Glucose Monitor), Bevel analyzes how your logged foods influence your glucose response.
How It Works
Log your meals in the Nutrition section.
Connect a CGM device to track real-time glucose data.
Bevel evaluates your glucose response after each meal, looking at how much your glucose rises, how long it stays elevated, and how much it changes from start to finish.
Results are compared to your personal history. A “good” score means the meal keeps your blood sugar steadier than your meals typically do, while a lower score indicates a greater glucose response than usual for you.
Stable glucose responses support a higher Glucose Impact score. Large glucose spikes may lower your score.
Your Glucose Impact updates throughout the day as more data becomes available.
How it combines with Food Quality
Your overall Nutrition Score is an average of:
Food Quality Score: based on the nutrients in your food.
Glucose Impact Score: based on how your body actually responded to it.
If you don’t have a CGM connected or glucose data isn’t available, your Nutrition Score will rely solely on the Food Quality score.
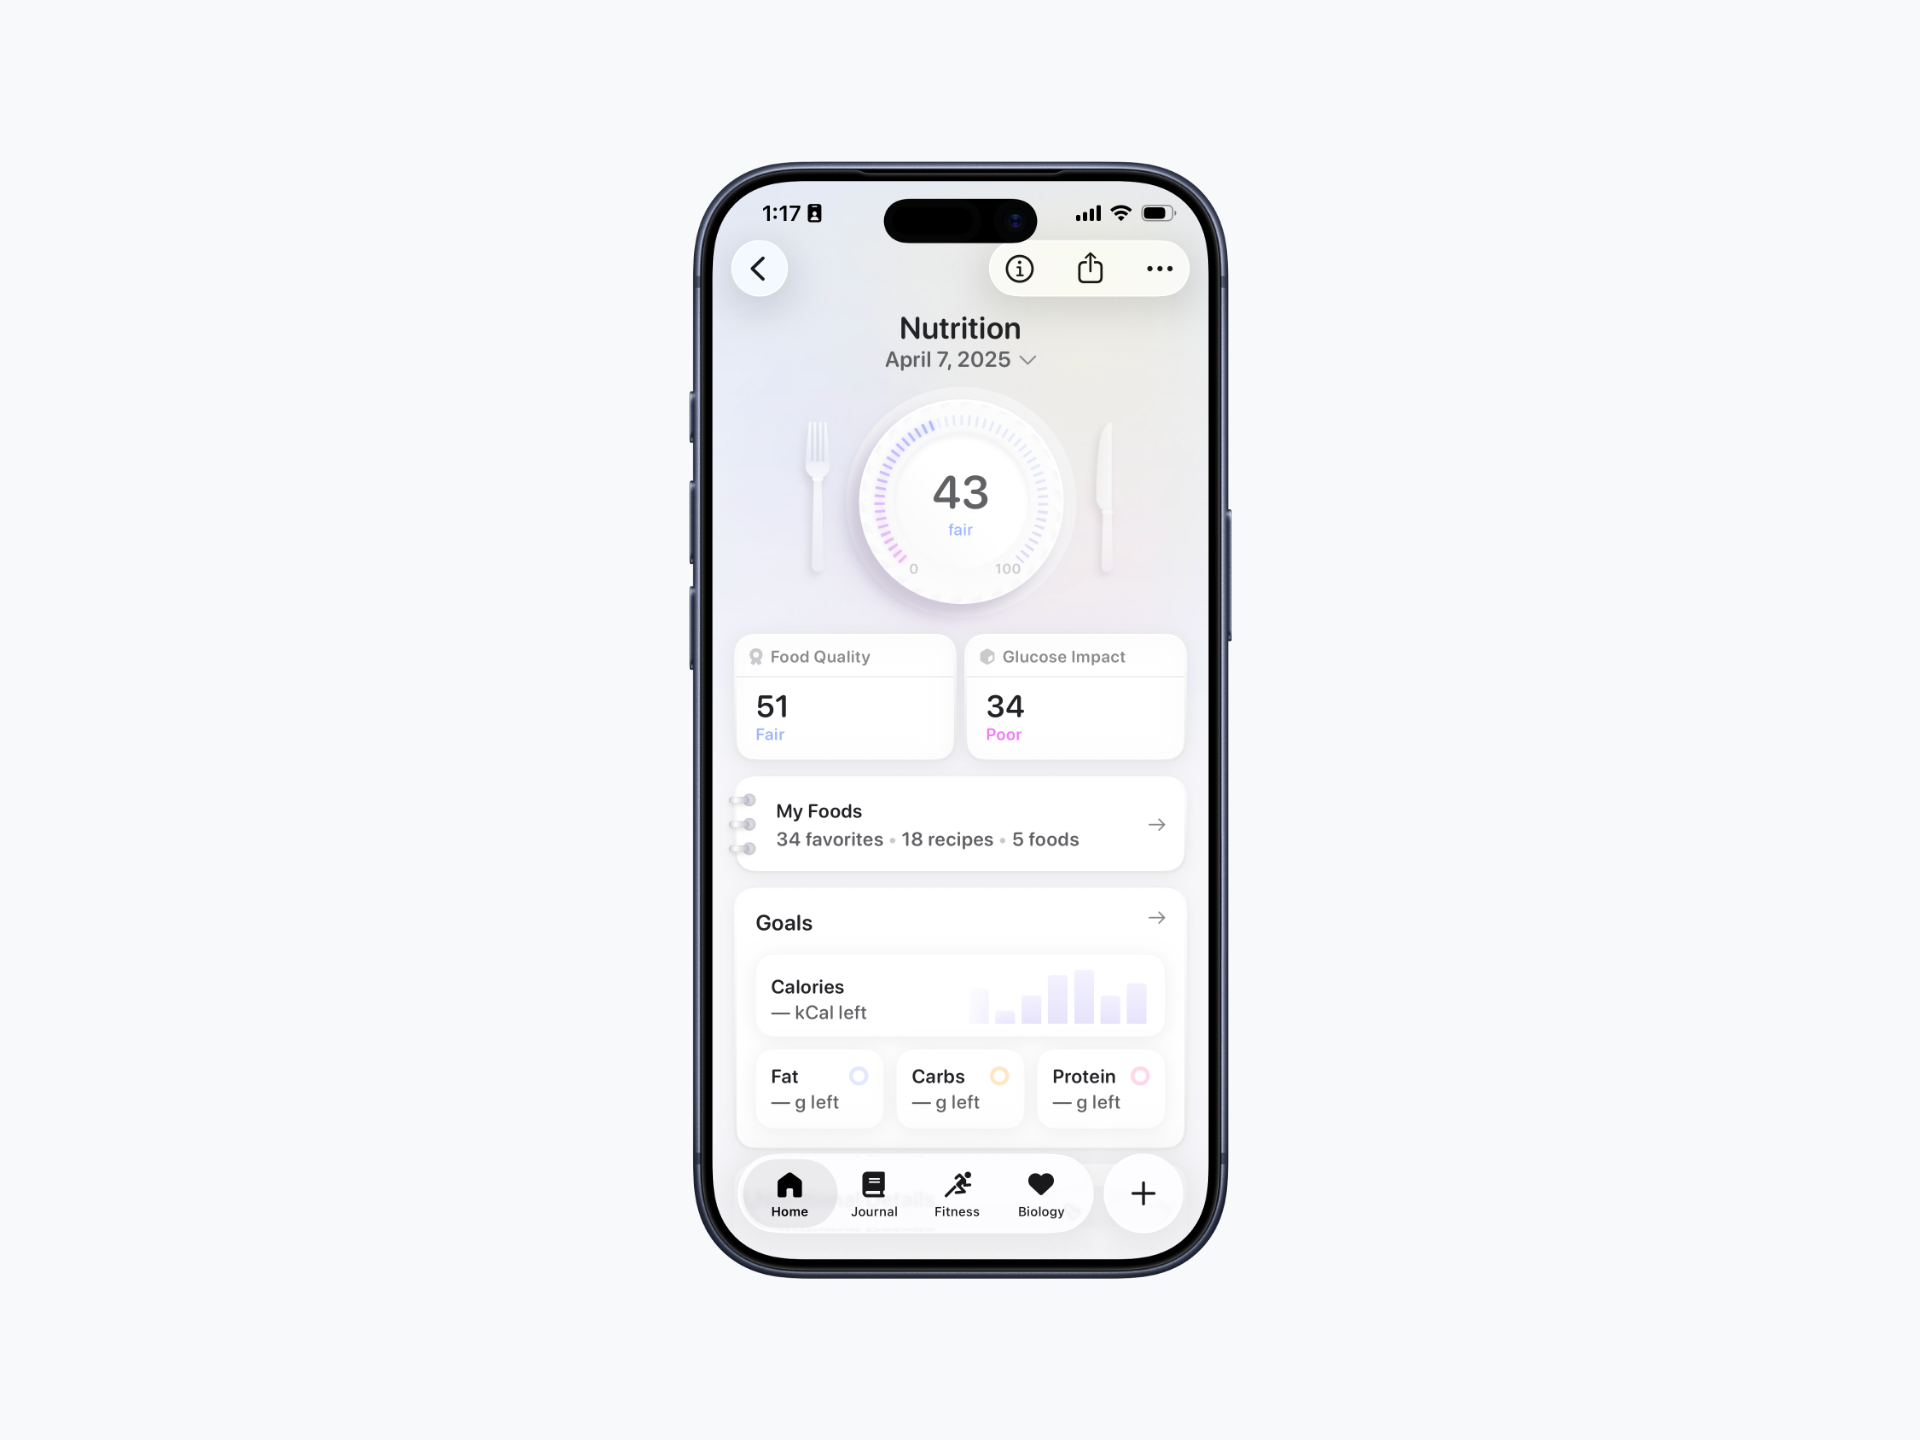
How to View Food Quality Score and Glucose Impact Score
Open Bevel.
Scroll down to the Nutrition section and tap to open it.
At the top of the screen, you will see your Food Quality Score on the left and your Glucose Impact Score on the right.
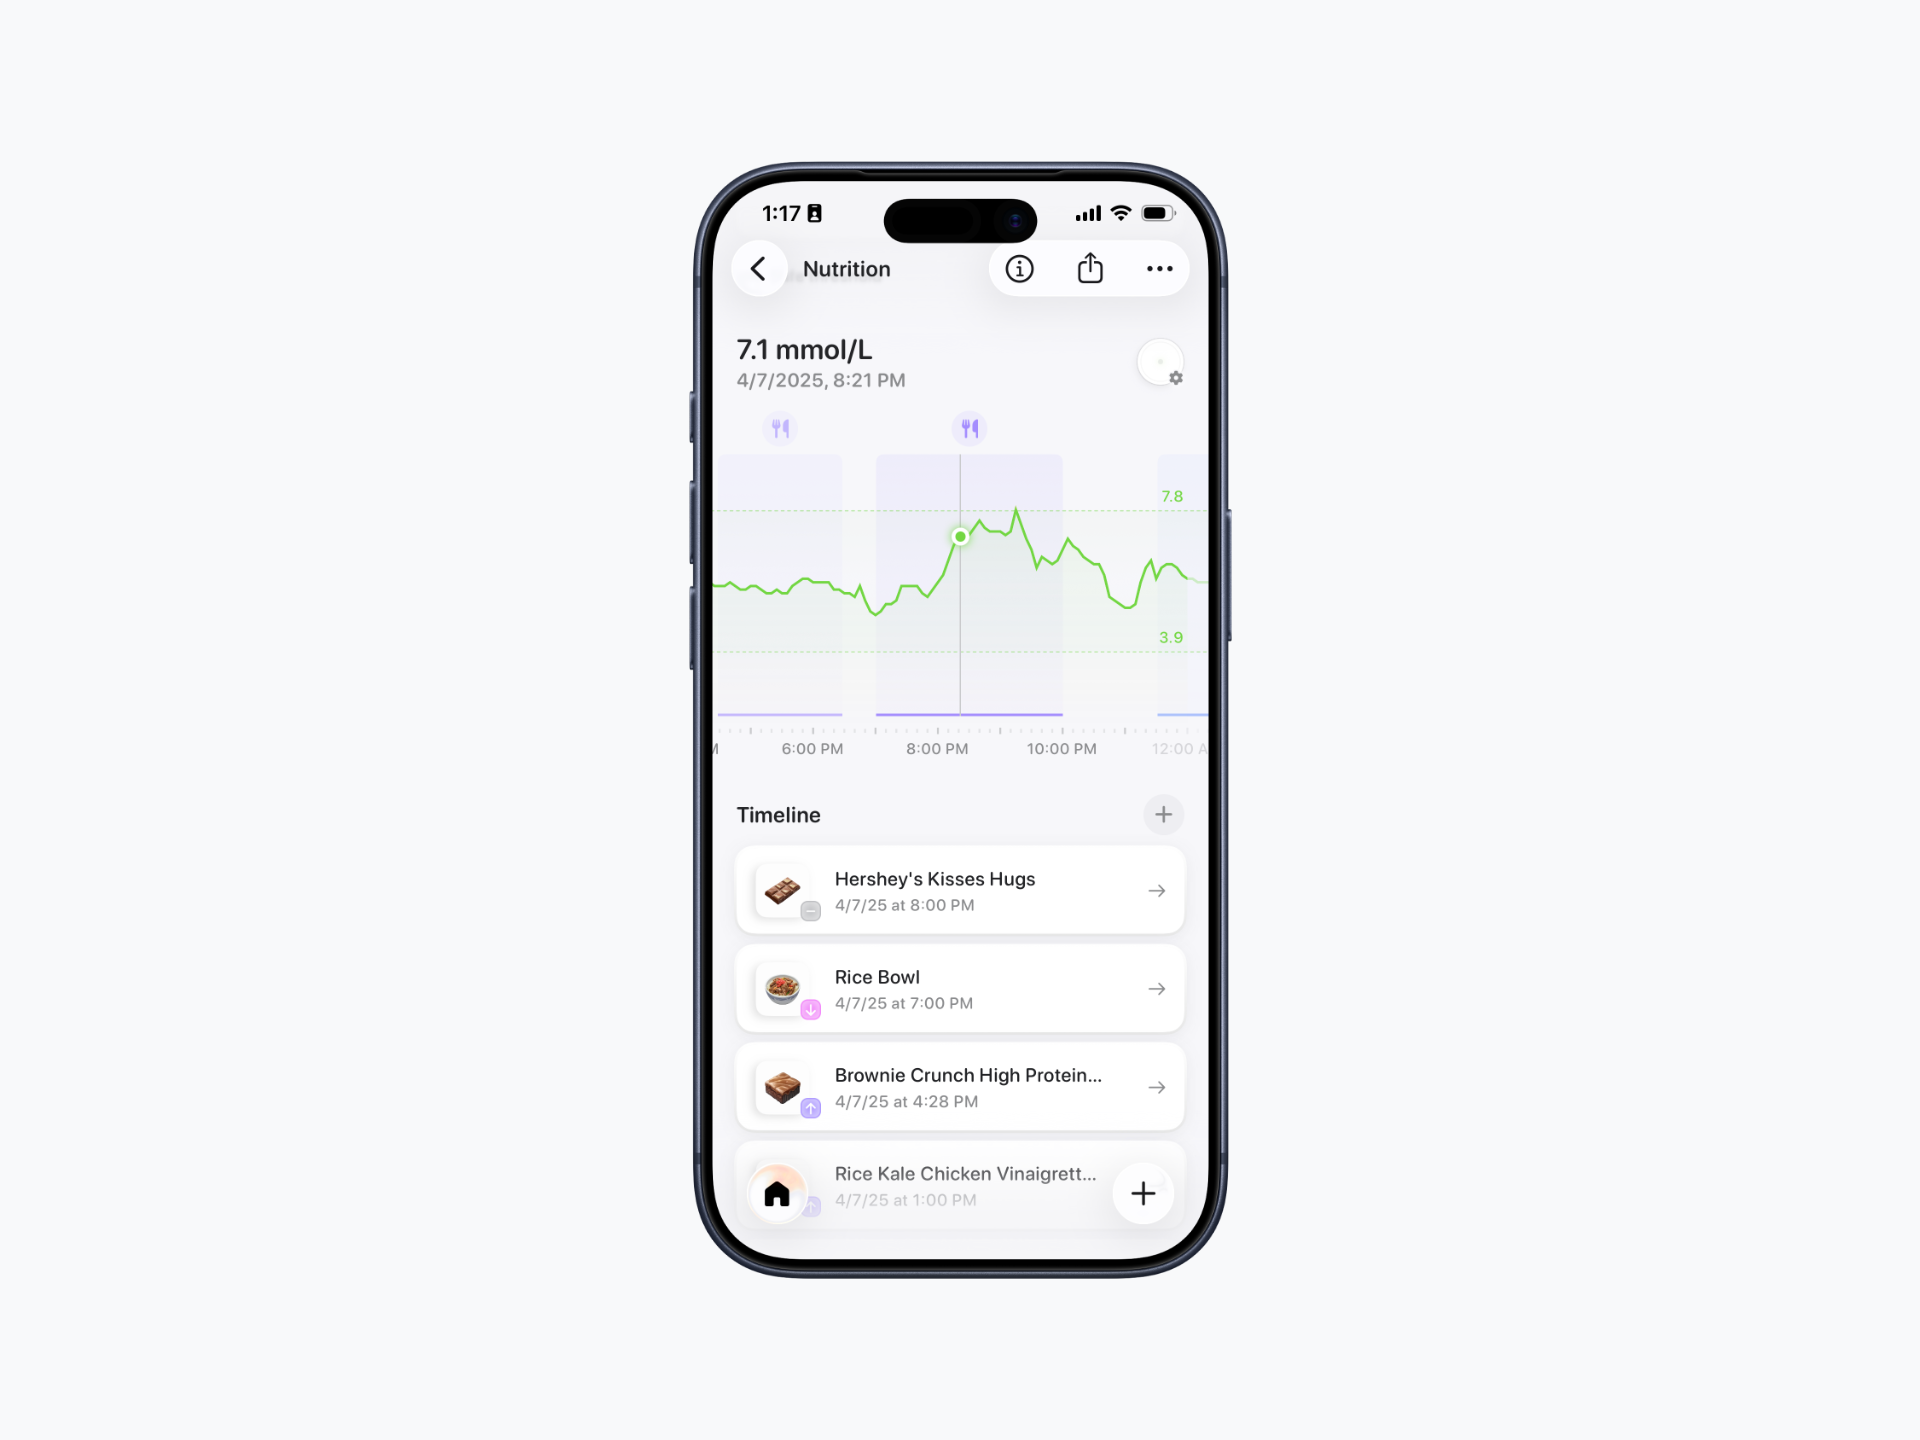
If connected to a CGM, scroll down to view more detailed glucose insights tied to your logged meals.
You’ll find this section below Food Quality Contributors and above Timeline.
This view includes a chart that shows:
When you ate
How your glucose responded after each meal
Activities completed
The chart helps you clearly see the relationship between your food choices, your glucose trends, and your activities throughout the day.